Rockford Wines - Getting the right information.


This case study highlights initiatives taken by Rockford Wines to reduce their energy usage and demand by taking the first step of getting the right information from their electricity retailer.
Based in Barossa, Rockford Wines is an independent, family-owned winery that is committed to maintaining the best of Australia’s traditional wine trade. The business was founded upon, and continues to operate by, a set of principles which ensure long term stability and health of the business, the village of Krondorf and the Barossa community.
Rockford Wines is committed to ensuring all business operations minimise environmental impact and, wherever possible, create positive environmental outcomes. In late 2016 Rockford installed a solar energy system to reduce their energy usage, and in 2019 focus turned to reducing demand and the associated costs. But where to start?
Rockford’s participated in the Winery Energy Demand Management Program, funded by Green Industries South Australia (GISA) and managed by the South Australian Wine Industry Association (SAWIA) to engage energy experts 2XE to help.
The first step was to examine electricity bills, and to get interval meter data either from their retailer or from the SA Power Networks (SAPN) website.
With the interval meter data, Rockford was able to identify when they were using electricity. In this case, Rockford has a maximum demand during the peak demand monitoring period. This provided Rockford with the information needed to give consideration to shifting refrigeration loads.
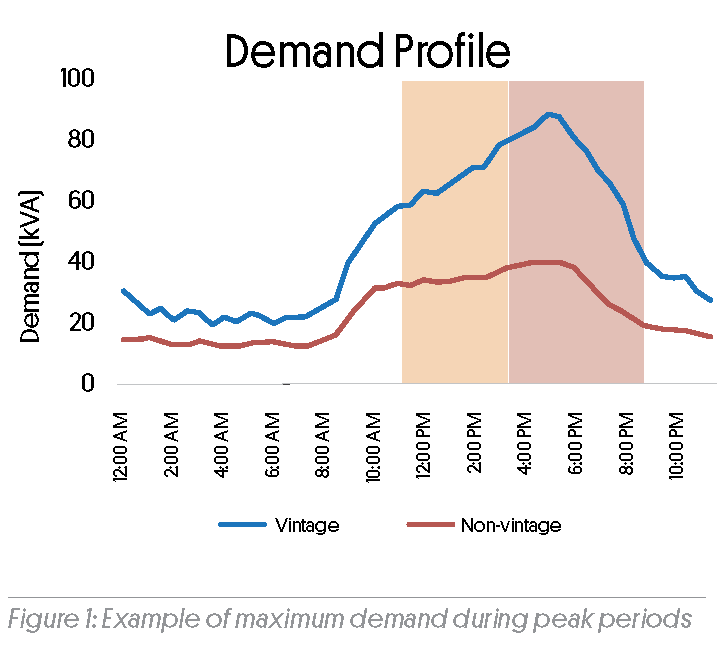 An example of a typical winery refrigeration demand profile is included in Figure 1.
The information also enabled Rockford to identify other refrigeration opportunities to reduce both electricity demand and electricity usage.
These include:
• Moving from refrigerated to evaporative air conditioning in open cellars
• Operating refrigeration systems to increase cooling during off-peak times
• Using a pulsed spray to increase the cooling of coils of condensers
These combined refrigeration projects are expected to achieve the following savings:
Refrigeration
• Expected energy savings 7 MWh p.a.
• Expected cost savings $6,500 p.a.
• Return on investment < 1 year
• GHG emissions savings 3.57 tCO2e
• Max KVA load eliminated from grid 25 KVA
Power factor is the measure of real power (kWh) used by a load and apparent power (kVA). In an ideal circuit the kVA and kWh would be the same.
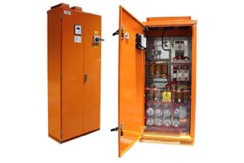 Through heat maps Rockford discovered that the power factor during peak demand was poor. In order to increase “useful power” and decrease excess demand charges a Power Factor Correction Unit (Figure 2) could be installed. The initial investment would be roughly $7000, with an estimated annual saving of $1700, and more importantly reduce Rockford’s energy demand.
By examining electricity bills Rockford was also able to understand their energy use profile and find out what’s costing the most money. After all, most electricity bills are really four bills rolled into one:
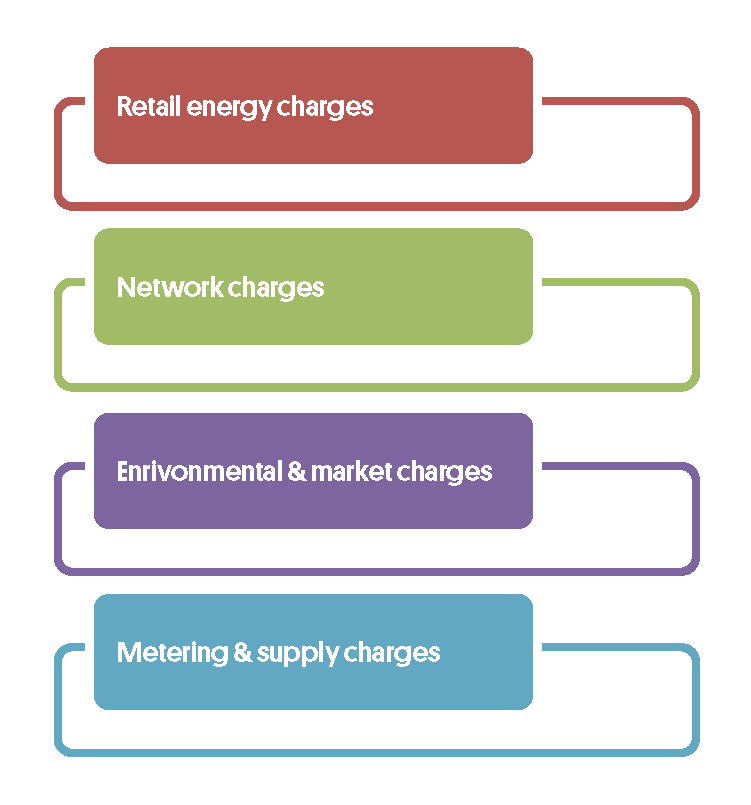
So, which one should Rockford target first?
Well, for Rockford, this wasn’t an easy question to answer. Rockford’s electricity retailer uses bundled bills. This means that four bills are summarised into a few lines. This is designed to ‘make it easier’ to understand electricity but bundled bills can mask additional charges or expenses. This can be a problem when you want to reduce these expenses.
Just to make things a little more complicated, Rockford is not billed every month, despite requests.
Instead, they may be charged monthly or quarterly (and everything in between). Tracking energy performance with these bills can be very tricky!
Determining the site’s retail rates and tariffs gave Rockford an understanding of how much each part of the electricity bills were costing them. This provided better information, but still didn’t provide enough information to start managing electricity costs - the interval meter data was also required.
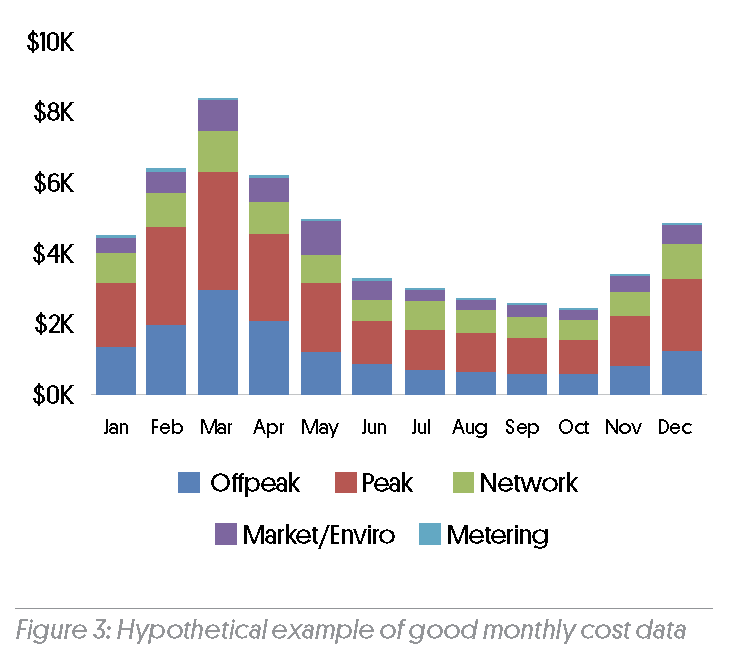 Using the interval meter data, Rockford was now able to see what their monthly electricity costs would look like if they were billed monthly (Figure 3). This new information helped Rockford understand their energy use profile and, what was driving electricity costs.
The next step for Rockford is to negotiate with its current retailer or engage a new retailer to get consistent monthly electricity bills, unbundled bills, and use its retailer’s energy portal. This portal will enable Rockford to monitor and track when they use electricity throughout the day, and work towards ensuring the long term stability of the winery. After all, retailers should provide good rates and even better information. Make your retailer work for you and long term stability of the winery. After all, retailers should provide good rates and even better information. Make your retailer work for you.